
The appropriate statistical test is the two-way or contingency table chi-square test.
Several years ago, a number of residents of Vail, Colorado, complained of intestinal distress. The Department of Health conducted a telephone epidemiological survey to identify potential causes of the intestinal problem. In addition to indicating whether or not they had the intestinal problem ("well" versus "sick"), respondents also answered questions about the usual suspects--recent consumption of egg salad, eating at a picnic where food was not refridgerated for a long time, and drinking water from the municipal water supply ("tap") versus water purchased in containers ("bottle"). Among the eighty-one respondents drinking tap water, forty-nine or 49/81 = 60 percent were sick; among the thirty respondents drinking bottle water, only six or 6/30 = 20 percent were sick. Does this suggest the source of the intestinal problem might be the municipal water supply?
| Health | Tap | Bottle | Total |
| Well | 32 | 24 | 56 |
| Sick | 49 | 6 | 55 |
| Total | 81 | 30 | 111 |
The Department of Health conducted a telephone survey epidemiological survey to identify
potential causes of an intestinal problem that was prevalent in Vail. A contingency table analysis
reveals a significant relationship between source of drinking water (tap or bottled) and health status
(sick or well) such that those drinking tap water were 3 times (60% versus 20%) as likely to be sick as those drinking
bottled water (Chi-sq(1) = 14.36, p = 0.0002). Although this correlation does not prove that drinking
tap water is the soure of the problem, it does suggest that the water treatment plant should be checked.
Postscript: When this check was done, one component of the purification system was found to be malfunctioning.
Fixing that component quickly eliminated the intestinal problem.
#create a matrix, specifying the number of rows in the matrix.
#the labels provided by dimnames are option, but usually very helpful
#note that the row names come first, then the column names
> vail <- matrix(c(32,49,24,6),nrow=2,dimnames=list(c("well","sick"),c("tap","bottle")))
> vail
tap bottle
well 32 24
sick 49 6
#there is a "continuity correction" that is sometimes used to compute the chi-square.
#most stat programs do not use this correction, but R does by default
#using the option 'correct=F' turns off that correction
> chisq.test(vail,correct=F)
Pearson's Chi-squared test
data: vail
X-squared = 14.3601, df = 1, p-value = 0.0001510
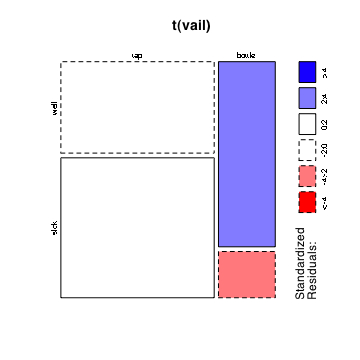
#generate a useful mosaic plot.
#for unknown reasons, mosaicplot reverses the rows and columns, so a transpose t() puts them
#back in the same order as shown above
> mosaicplot(t(vail),shade=T)
#blue areas in the mosaic plot indicate excess cases and red areas indicate fewer cases
#than expected if the variables were independent
First create a data set like this:
Menu: Analyze > Correlations > Contingency Table--Two-Way Data
which opens a dialog window like this one for selecting the levels of one of the
variables:
Drag the Tap and Bottle names into the Counts box on the left. Then click "OK" to produce
results such as the following:
Portion of data window:
Menu: Analyze > Fit Y by X
Create a worksheet like this:
Use either the command below or the
Menu: Stat > Tables > Chi-Square Test
In Excel, there is no appropriate procedure in the Data Analysis Tools.
© 2002, Gary McClelland