
The appropriate statistical test is the one-sample or one-way chi-square test, sometimes also called the goodness-of-fit chi-square test. The chi-square test evaluates the difference between the observed (O) number of events in each of k categories to the expected (E) number of events in each respective category.

The calculated value of the chi-square statistic is compared to the chi-square distribution with k - 1 degrees of freedom.
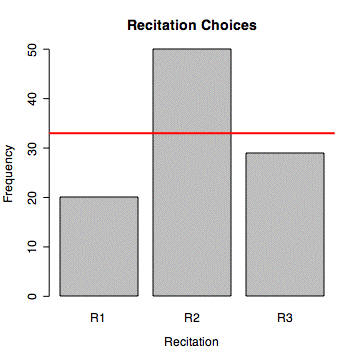
Suppose three recitation sections for a larger class are offered at the same time by three different teaching assistants. The 99 students in the class are allowed to select their recitation section after the first two weeks of class. If student selected randomly, we would expect about 33 students to be enrolled in each recitation. In fact, the enrollments in the three recitations were 20, 50, and 29. Are these observed frequencies sufficiently different from the expected frequencies of 33 to reject the hypothesis that students selected recitation sections randomly?
| Recitation 1 | Recitation 2 | Recitation 3 | Sum | |
| 0 | 20 | 50 | 29 | 99 |
| E | 33 | 33 | 33 | 99 |
| O-E | -13 | 17 | -4 | 0 |
 |
5.1 | 8.8 | 0.5 | 14.3 |
Niney-nine students in a large lecture class were allowed to select one of three recitation sections offered at the same time. The actual frequencies of choice (20, 50, and 29) differed significantly from the 33 students per section if student had chosen randomly (Chi-Square(2) = 14.3, p < .001).
Many computer programs do not provide procedures for the one-sample chi-square test. The calculations are easy to do with a hand calculator.
> obs <- c(20,50,29)
#do chisq goodness-of-fit test with null hyp = equal frequencies
> chisq.test(obs)
	Chi-squared test for given probabilities

data:  obs
X-squared = 14.3636, df = 2, p-value = 0.0007603


> barplot(obs,names.arg=c("R1","R2","R3"),xlab="Recitation",ylab="Frequency",main="Recitation Choices")
> #add line at the expected frequency
> abline(33,0,lwd=2,col='red')

#if testing other than equal frequencies, use p to specify the relative proportions
# for example, if testing the hypothesis that the choice proportions would be 1/4, 1/2, and 1/4 use
> chisq.test(obs,p=c(.25,.5,.25))

	Chi-squared test for given probabilities

data:  obs
X-squared = 1.6465, df = 2, p-value = 0.439
© 2002, Gary McClelland