The value of z is then compared to the normal distribution.

The appropriate statistical test is the normal
distribution z-test.

The value of z is then compared to the normal distribution.
On the first day of statistics class, fifteen students take a 20-item true/false test. If
they were guessing, their scores would have a binomial distribution with mean = 10
and standard deviation = Square Root(.5 * .5 * 20) = 2.24. The actual mean score for the fifteen
students was 11.53. The z-test is

The two-tailed probability of getting a z-score as high as 2.65 by chance is only
0.008. Hence, we reject the hypothesis that the students were guessing and conclude that
they knew the correct answers for at least a few of the twenty items.
On a 20-item true/false test given on the first day of class, the mean score for 15 students equaled 11.5, which was significantly greater (z = 2.65, p = .008) than the expected mean score of 10 if all students had been guessing on all the items.
> z <- (11.53 - 10)/(2.24/sqrt(15))
> z
[1] 2.645386

> p <- 2*(1-pnorm(z))
> p
[1] 0.008159779
Statview will not directly perform this statistical test. Use the one-group t-test, which assumes that the standard deviation is not known.
Under the ANALYZE menu select DISTRIBUTION, then select the variable.
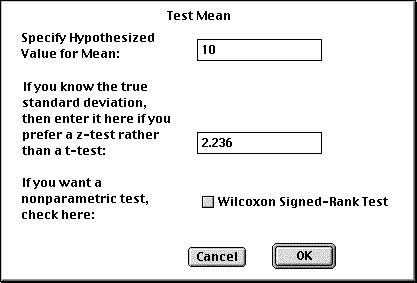
Then select the option for "Testing Mean = ", which will open the following dialog box.
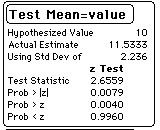
Enter the mean to be tested (in this case, "10") and the known standard deviation (in this
case, "2.236").

which produces:

MTB > ZTest 10 2.24 'SKQ-Pre';
SUBC>   Alternative 2.
produces:
Test of mu = 10.000 vs mu <> 10.000
The assumed sigma = 2.24

Variable     N      Mean    StDev   SE Mean        Z    P-Value
SKQ-Pre     15    11.533    2.200     0.578     2.65     0.008
Excel will not directly perform this statistical test with the tools available in the Data Analysis toolpack. Download ztest.xls, an Excel worksheet that will perform the z-test for the mean when the variance is known.
© 2002, Gary McClelland