The appropriate statistical test is a two-way between-subjects factorial analysis of variance (two-way ANOVA).
An experiment was performed to examine the effect of allowing students
to use calculators when solving SAT-type math questions. The experimenter
randomly assigned half of 18 particpants to use calculators and have to not
use calculators. Each group of 9 was further subdivided to work one of three
types of problems: Write--no choice answers are provided so the person must
write out a numerical answer with no hints; AorB--two mathematical statements (A and B)
are provided with choice options of 'A = B', 'A > B', 'A < B', 'can't be determined'; and Multiple
Choice--standard multiple-choice style questions. Each participant tries to answer 25 questions
of the type to be which they were randomly assigned. The following data result:
| Type | |||
| Calc | Write | AorB | MulCh |
| No | 11, 15, 13 | 16, 14, 15 | 18, 19, 17 |
| Yes | 10 14, 12 | 18, 19, 23 | 23, 19, 24 |
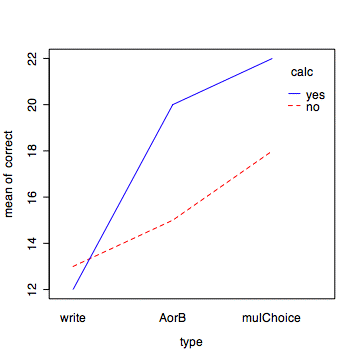
On average, across types of problems, the use of calculators improves performance on 25 math questions (M = 18 vs. M = 15.33, F(1,12) = 8.0, p = .015). Ignoring whether calculators were used or not, the three types of problems were not equally difficult (M = 12.5, M= 17.5, and M = 20, respectively for Write, AorB, and Multiple Choice problems, F(2,12) = 21.88, p < .0001). That is, problems for which choices were provided were easier than ones where the students wrote an answer with no hints. As can be seen in the interaction plot, the effet of calculators depended ( F(2,12) = 3.88, p = .0503) on the type of problem. For the Write problems there was essentially no difference in the number correct with and without the calculator (M=12 and M=13, respectively). However, for the problems with choices provided the benefit of calculators was sizeable--those using calculators answered an average of 4.5 more problems correct. Hence, calculators provide the most benefit when possible answers are available as choice options.
Either create a separate input file and read it in as a table or use the following commands for generating patterned data. The gl() function generates levels. The first number is the number of levels, the second number is how many consecutive levels should be generated before switching to the next level (or returning to the first level), and the last number is the total number of values to be generated. The commands below generate the table above by rows.
> calc <- gl(2,9,18, labels=c('no','yes'))
> calc
 [1] no  no  no  no  no  no  no  no  no  yes yes yes yes yes yes yes yes yes
Levels: no yes

> type <- gl(3,3,18, labels=c('write','AorB','mulChoice'))
> type
 [1] write     write     write     AorB      AorB      AorB      mulChoice
 [8] mulChoice mulChoice write     write     write     AorB      AorB
[15] AorB      mulChoice mulChoice mulChoice
Levels: write AorB mulChoice

#now the depenent variable, by rows
> correct <- c(11,15,13,16,14,15,18,19,17,10,14,12,18,19,23,23,19,24)
#create a data.frame aggregating the the two level variables and the dependent variable
> calcData <- data.frame(calc, type, correct)
> calcData
   calc      type correct
1    no     write      11
2    no     write      15
3    no     write      13
4    no      AorB      16
5    no      AorB      14
6    no      AorB      15
7    no mulChoice      18
8    no mulChoice      19
9    no mulChoice      17
10  yes     write      10
11  yes     write      14
12  yes     write      12
13  yes      AorB      18
14  yes      AorB      19
15  yes      AorB      23
16  yes mulChoice      23
17  yes mulChoice      19
18  yes mulChoice      24

> #the notation calc*type is the same as calc + type + calc:type
> #or in other words, the two main effets and the interaction
> calc.aov <- aov(correct ~ calc*type)
> summary(calc.aov)
            Df Sum Sq Mean Sq F value    Pr(>F)
calc         1   32.0    32.0   8.000   0.01522 *
type         2  175.0    87.5  21.875 9.945e-05 ***
calc:type    2   31.0    15.5   3.875   0.05031 .
Residuals   12   48.0     4.0
---
Signif. codes:  0 Ô***Õ 0.001 Ô**Õ 0.01 Ô*Õ 0.05 Ô.Õ 0.1 Ô Õ 1

> # compute the means for each row
> tapply(correct, calc, mean)
      no      yes
15.33333 18.00000
> #now for each column
> tapply(correct, type, mean)
    write      AorB mulChoice
     12.5      17.5      20.0
># finaly, compute the means for each cell
> tapply(correct, calc:type, mean)
     no:write       no:AorB  no:mulChoice     yes:write      yes:AorB
           13            15            18            12            20
yes:mulChoice
           22

> interaction.plot(type, calc, correct, col=c('red','blue'))

In Excel, use Anova: Two-Factor With Replication in the Data Analysis Tools.
© 2007, Gary McClelland