

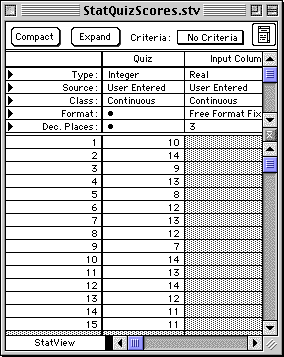
Fifteen students in an honors undergraduate statistics class took a 20-item true/false quiz on the first day of class. Their scores were:
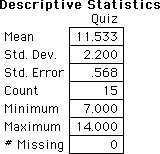
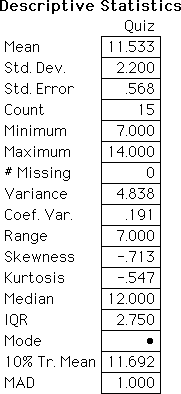
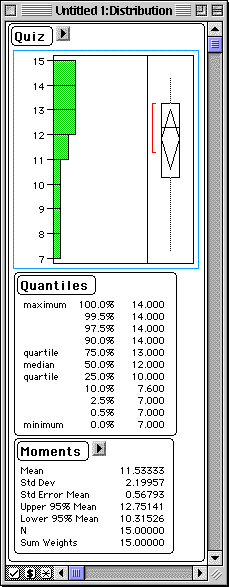
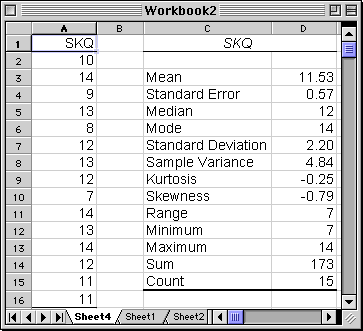
The mean is 11.5 and the median is 12. Three different socres (12, 13, 14) tie for the most frequent so there is not a unique mode. The standard deviation is 2.2 and the MAD is 1. The minimum is 7 and the maximum is 14 so the range is 7. The IQR is 2.5. (Note: because of the way different programs treat ties, there may be small differences in the values reported for the median and the IQR.)
The typical score for 15 students taking a 20-item true/false quiz on the first day of class was about 11.5 (mean) or 12 (median), which is slightly higher than the expected typical score of 10 if all 15 students had been guessing on all 20 items. There was a range of 7 points with the typical deviation from the typical score being about 2.2 (standard deviation).
> skq <- c(10,14,9,13,8,12,13,12,7,14,13,14,12,11,11)
> summary(skq)
   Min. 1st Qu.  Median    Mean 3rd Qu.    Max.
   7.00   10.50   12.00   11.53   13.00   14.00
> sd(skq)
[1] 2.199567
> IQR(skq)
[1] 2.5
#for mad, specify constant=1 so it won't use the normal extrapolation to s
> mad(skq, constant=1)
[1] 1

#some useful graphs
> boxplot(skq,main="Statistical Knowledge Quiz",ylab="Score (out of 20)",
+ col='red')
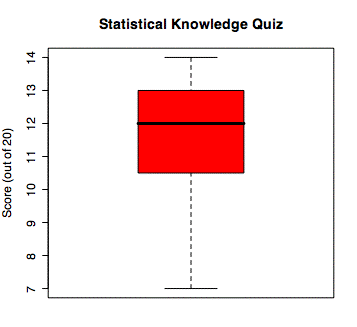
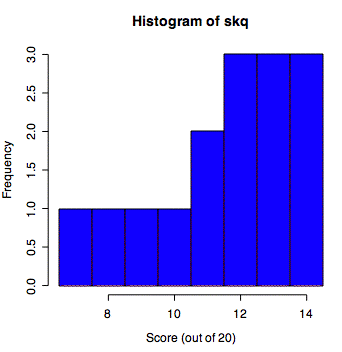
# breaks specifies the column boundaries, in this case from 6.5 to 14.5 by 1
hist(skq,breaks=6.5:14.5,xlab="Score (out of 20)",col="blue")
Menu: Analyze > Descriptive Statistics > Descriptive Statistics
Menu: Analyze > Graphs > Histogram
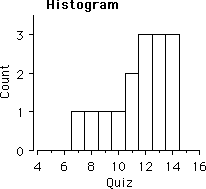
Menu: Analyze > Descriptive Statistics > Descriptive Statistics--Complete
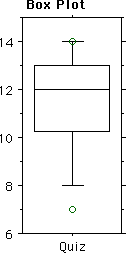
Menu: Analyze > Graphs > Boxplot
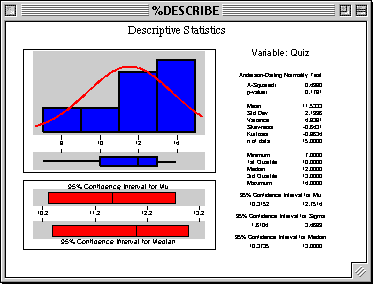
MTB > Describe 'Quiz'.

Descriptive Statistics


Variable        N     Mean   Median   TrMean    StDev   SEMean
Quiz           15   11.533   12.000   11.692    2.200    0.568

Variable      Min      Max       Q1       Q3
Quiz        7.000   14.000   10.000   13.000
© 2002, Gary McClelland