
www.seeingstatistics.com
Start >
Differences >
Ranks
Nonparametric Tests
There are specialized statistical tests for comparing data as ranks; these
tests are oftern referred to as nonparametric tests.
However,
for most simple ordinal questions--either simple relationships or
differences between groups with one independent variable, an equivalent
statistical test is obtained by simply converting all the data to ranks
(if they aren't ranks already) and then using the appropriate
statistical test treating the ranks as scores. This eliminates the need
to learn a lot of specialized nonparametric procedures for ordinal data.
If there is more than one independent variable then there are no appropriate
statistical tests.
If you have one independent variable,
convert your data to ranks and treat them as scores. (see below an example of how to convert
your data to ranks).
Example
To demonstrate the similarity between nonparametric statistics and the usual
parametric statistic applied to ranks, let's consider the example used for the
unpaired t-test (all the necessary details are repeated
here so you do not need to visit that link). The appropriate nonparametric statistical test
(if either we had only the rank order of the dependent variable or if we wished to consider
only the ordering of the scores of the dependnet variable) is the Mann-Whitney U-Test (also
sometimes called the Wilcoxon Rank Sums Test).
In a study of pain mechanisms, behavioral neuroscientists
injected a group of rats with a drug that would increase pain
sensitivity if a certain neural pathway was involved in pain.
Pain sensitivity was measured by the time (in seconds) it took
for the rat to flick its tail away from a heat lamp. Longer
times until tail flick indicate less pain sensitivity. Testing
was always stopped after ten seconds before there could be any
injury to the rats. Data from the injected group were compared
to a placebo group in which rats received inert injections.
Below are the data for fourteen rats, seven in each group:
Placebo: 2.6 10 9.5 7.4 6.9 8.5 5.2
Drug: 2.2 3.8 7.1 2.7 6.2 5.3 3.1
The neuroscientists want to know whether the drug increased pain sensitivity.
If the drug had absolutely no effect, then we would expect the mean tail flick time
in the placebo group to be the same as the mean tail flick time in the
drug group.
Summary
In a study of pain sensitivity, the times it took 14 rats to flick their tails away from a heat
source were ordered from 1 (fastest and therefor more pain sensitive) to 14 (slowest and
less pain sensitive). The mean rank for the seven rats injected with a drug believed to
increase pain sensitivity of 5.4 was not significantly different from the mean rank for the
seven rats injected with a placebo of 9.6 (Mann-Whitney U = 10, z = 1.85, p = .06). Hence,
even though the difference in mean ranks of pain sensitivity is large, we cannot conclude
that the drug significantly affected pain sensitivity.
The Mann-Whitney U test is also known as the Wilcoxon Rank Sum test. It is appropriate when the data are actually ranks
or when you do not want to assume the observations have a normal distribution within each group.
However, it makes the same assumption as Stuent's t-test that the variances in each group are
roughly the same.
Note that a t-test applied to the ranks yields the same conclusion
that the difference between the mean ranks is not statistically significant (t(12) = 2.08, p = .06).
Finally note that both tests on ranks, either the Mann-Whitney U or the Student t-test applied
to ranked data, are less powerful than the Student t-test applied to the original data. In
this case, that test does reveal a significnat difference in pain sensitivity between the two
groups.
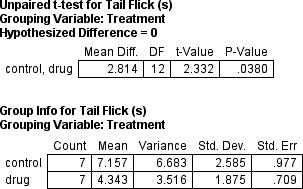
The mean difference of 2.8 seconds is statistically significant (t(12) = 2.33, p = .038).
Thus, the drug indeed increased pain sensitivity, at least according to the more powerful
statistical test.
R
> flick <- c(2.6,10,9.5,7.4,6.9,8.5,5.2,2.2,3.8,7.1,2.7,6.2,5.3,3.1)
> group <- factor(c(rep("placebo",7),rep("drug",7)))

> wilcox.test(flick ~ group)

	Wilcoxon rank sum test

data:  flick by group
W = 10, p-value = 0.07284
alternative hypothesis: true mu is not equal to 0
#note: R uses an exact calulation of p, rather than the asymptotic approximation commonly
# used by other programs.

#compare to t-test performed on the ranks of the dependent variable
> t.test(rank(flick) ~ group,var.equal=T)

	Two Sample t-test

data:  rank(flick) by group
t = -2.075, df = 12, p-value = 0.06016
alternative hypothesis: true difference in means is not equal to 0
95 percent confidence interval:
 -8.4930656  0.2073513
sample estimates:
   mean in group drug mean in group placebo
             5.428571              9.571429
StatView
Prepare a dataset like this one:
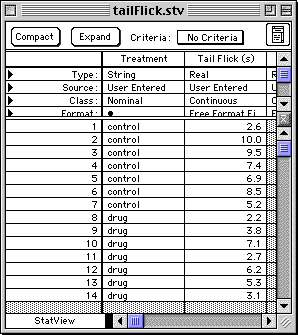
Then compute ranks for the dependent variable TailFlick:
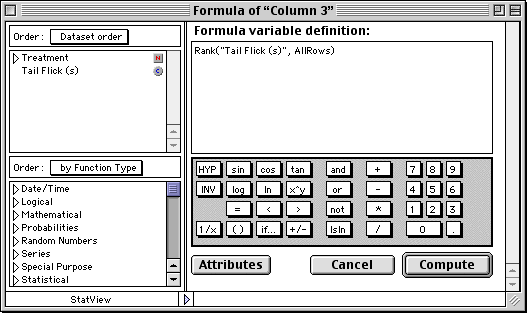
Menu: Manage > Formula
and fill in Rank("TailFlick(s)",AllRows) in the Formula variale definition window.
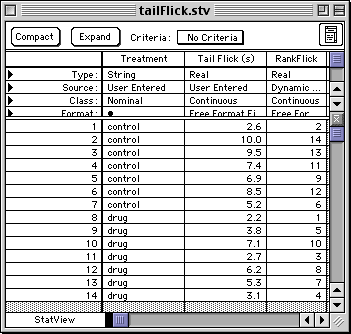
Dataset after clicking Compute in the previous Formula box above and renaming
"Column 3" to "RankFlick"
To do the Mann-Whitney U-test on ranks:
Menu: Analyze > Nonparametrics > Mann Whitney
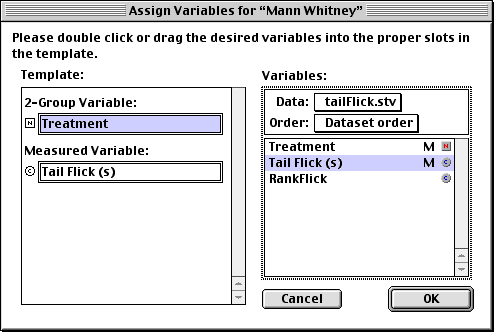
which produces:
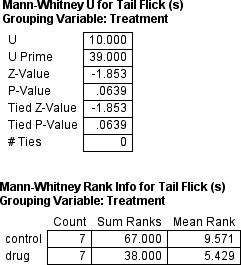
Compare this to the results for the usual Student
t-test using the ranks as the dependent variable:
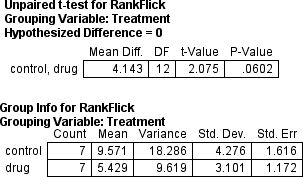
which produces almost the same p-value: .0602 versus .0639. And also notice that
simply applying the Student t-test to the original unranked data is, as is usally the
case, more power, and so yields a much lower p-value of .038.
© 2002, Gary McClelland


