
The mode--most likely category--and the proportion or percent in each category are the most useful descriptive statistics for categorical variables.
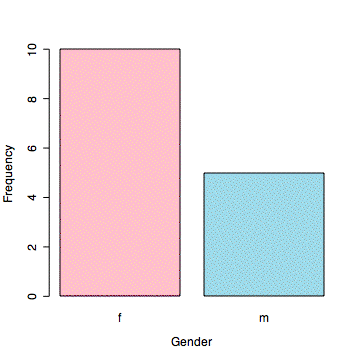
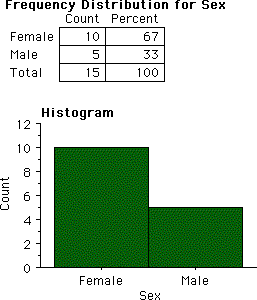
In an undergraduate honors statistics class taught in the psychology department, there were ten females and five males.
In a class of 15 students, females outnumbered males two to one. That is, ten (67%) were female and five (33%) were male.
Usually, a variable with nominal values would already be available in the dataset. However, for this example, we create the variable.
> gen <- c("m","f","f","m","f","f","m","f","f","f","m","f","f","m","f")
> #make sure variable is a factor; start here is variable already exists
> gen <- factor(gen)
> #examine counts of each factor level
> summary(gen)
 f  m
10  5

> #then use R as a calculator to compute proportions or percentages
> 10/(10 + 5)
[1] 0.6666667
> 5/(10 + 5)
[1] 0.3333333
> #or compute odds, in this case of female to male
> 10/5
[1]  2
> #a bar graph is overkill for two levels but may be useful for more
> plot(gen,xlab="Gender",ylab="Frequency",col=c("pink","lightblue"))
Menu: Analyze > Descriptive Statistics > Frequency Distribution
© 2002, Gary McClelland